PERCENTILE Function Examples – Excel, VBA, & Google Sheets
Download the example workbook
This Tutorial demonstrates how to use the Excel PERCENTILE Function in Excel to calculate the percentile.
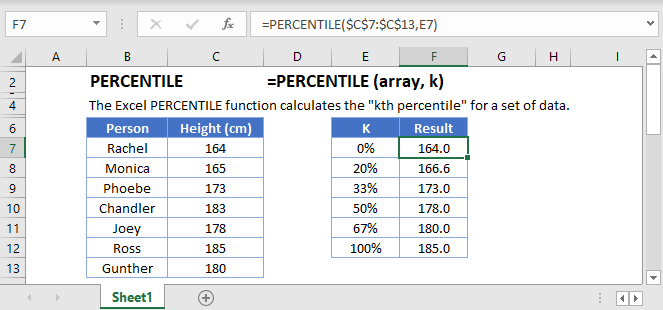
PERCENTILE Function Overview
The PERCENTILE Function Calculates the kth percentile.
To use the PERCENTILE Excel Worksheet Function, select a cell and type:
![]()
(Notice how the formula inputs appear)
PERCENTILE function Syntax and inputs:
=PERCENTILE(array,k)array – An array of numbers.
k – The percentile value in between 0 and 1.
What Is the PERCENTILE Function?
PERCENTILE is one of Excel’s statistical functions. It returns the k-th percentile of a given range of data.
PERCENTILE Is a “Compatibility” Function
As of Excel 2010, Microsoft replaced PERCENTILE with two variations: PERCENTILE.INC and PERCENTILE. EXC.
PERCENTILE still works, so older spreadsheets using it will continue to function as normal. However, if you don’t need your spreadsheet to remain compatible with older versions of Excel, you should use PERCENTILE.INC or PERCENTILE.EXC.
We’ll discuss all three so that you understand the ins-and-outs of each one.
What Is the Percentile?
The percentile tells you how a value compares to the other values in a given range. When a value is at the k-th percentile, this means that it is higher than k% of the other values in the group.
For example, if you’re a male living in the US and you’re 6ft (180cm) tall, you’re in the 71st percentile – you’re taller than 71% of other males in the US. If you’re female and 6ft (180cm) tall, you’re in the 99th percentile – you’re taller than 99% of other females.
When you’re dealing with percentiles, note that the 50th percentile is equal to the median <<link>> of the data.
The Excel PERCENTILE Function tells you what the cut off point for a given percentile is – which is to say, how high a value needs to be in order to be in the k-th percentile.
How to Use the PERCENTILE Function
Use PERCENTILE like this:
=PERCENTILE(C4:C13,F3)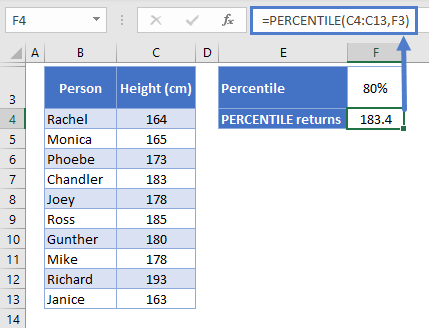
Here we have a few friends who have decided to calculate the 80th percentile of the height of their group, and we see the result – 183.4cm.
The first argument in the function is the range of data – their heights, which we have laid out in C4:C13.
The next argument is the percentile. In this example, I’ve put the percentile in cell F3, and then referenced that cell in the function. This way, it’s easy to change the percentile and see the new results.
However, you can put the percentile directly into the formula if you want. You can define it as a decimal, like this:
=PERCENTILE(C4:C13,.8)Or as a percentage, like this:
=PERCENTILE(C4:C13,80%)And these all return the same value.
A few things to be aware of with PERCENTILE:
- If the percentile you define isn’t a number, the function will return a #VALUE! error
- If the percentile is less than 0 or greater than 1, you’ll get a #NUM! error
- Text and blank cells within your data range will be ignored
Two Methods of Calculating Percentiles
Let’s put our data in order for a second:
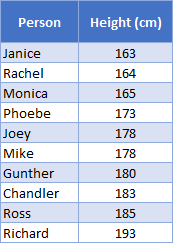
You might wonder why the 80th percentile isn’t 183, since Chandler is the 8th tallest person in the group.
Well, there are actually many ways to calculate the percentile mathematically, and no standardized or preferred method for all situations. This is something statisticians argue over in academic papers.
Excel gives you two ways of doing this, which brings us to PERCENTILE.INC and PERCENTILE.EXC.
PERCENTILE.INC
The Excel PERCENTILE.INC Function is the same as PERCENTILE. The “INC” part is short for inclusive, because it can calculate any valid percentile (that is, anything from 0% to 100%).
You use it like this:
=PERCENTILE.INC(C4:C13,F3)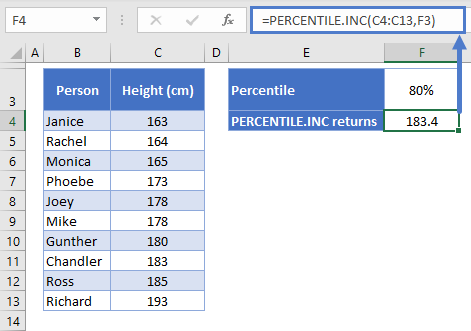
As you can see, it returns the same result that PERCENTILE did earlier.
So, going back to why the 80th percentile isn’t exactly equal to Chandler’s height. Remember, we’re doing an inclusive calculation here, so we’re including all k values from 0 to 1 (or 0% to 100%).
This means that our shortest friend, Janice, is at the 0th percentile, and Richard, the tallest, is the 100th percentile. All the other friends are at equal increments between the two, and that increment is equal to 1/(n-1), where n is the number of data points in the range.
In our case, that’s:
1 / (10 – 1) = 11.111…That means Chandler is not actually at the 80th percentile, he’s at the 77.777th percentile. If we plug that number into PERCENTILE.INC, we should get Chandler’s height…
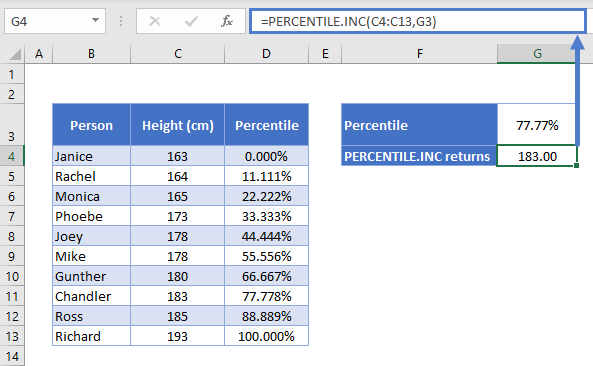
…and we do.
Linear Interpolation
Now, whenever the k value you specify is not a multiple of 1/(n-1), PERCENTILE.INC will apply a process called linear interpolation to calculate the result. This sounds complicated, but it basically means Excel will settle on a value between the two.
So why did we get 183.4 when we asked for the 80th percentile earlier?
The calculation works as follows:
- The 80th percentile falls between Chandler and Ross, Chandler at the 77.777th percentile, and Ross at the 88.888th.
- The 80th percentile is 2.222% ahead Chandler’s height
- We know there’s an 11% distance between Chandler and Ross’ heights
- 222% / 11.111% = 20% after rounding. Now we know that the 80th percentile is 20% of the way between Ross and Chandler’s heights.
- The difference between Ross’ height of 185cm, and Chandler’s height of 183cm, is 2cm
- 20% of 2cm is 0.4cm
- Add that on to Chandler’s height, and we get 183.4cm
PERCENTILE.EXC
You use PERCENTILE.EXC in essentially the same way:
=PERCENTILE.EXC(C4:C13,F3)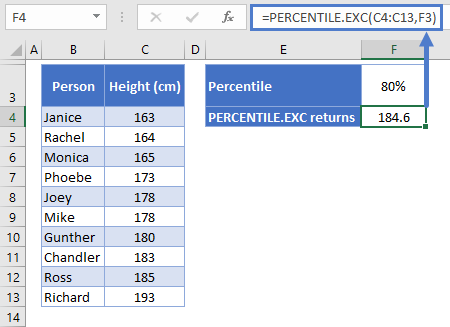
Okay, so we’ve got the same data, we want the same percentile, but we got different results. Why is that?
It’s because PERCENTILE.EXC excludes the first and last values when calculating its percentile intervals. See below:
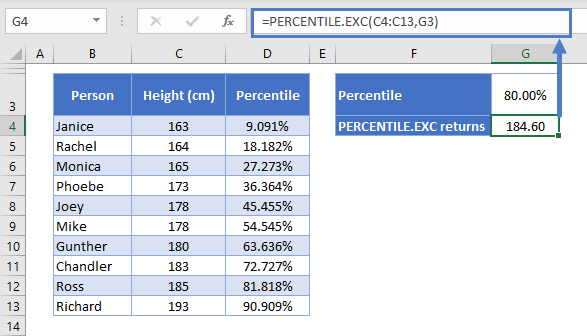
Rather than the interval being equal to 1/(n-1), with PERCENTILE.EXC the interval is 1/(n+1), or in this case, 9.091%.
Everything else works the same way as with PERCENTILE.INC. Again, the 80th percentile is between Chandler and Ross, so Excel applies the same method of linear interpolation:
- The 80th percentile falls between Chandler and Ross, Chandler at the 72.727th percentile, and Ross at the 81.818th.
- The 80th percentile is 7.272% ahead Chandler’s height
- We know there’s an 9.091% distance between Chandler and Ross’ heights
- 272% / 9.091% = 80% after rounding. Now we know that the 80th percentile is 80% of the way between Ross and Chandler’s heights.
- The difference between Ross’ height of 185cm, and Chandler’s height of 183cm, is 2cm
- 80% of 2cm is 1.6cm
- Add that on to Chandler’s height, and we get 184.6cm
PERCENTILE in Google Sheets
The PERCENTILE Function works exactly the same in Google Sheets as in Excel:
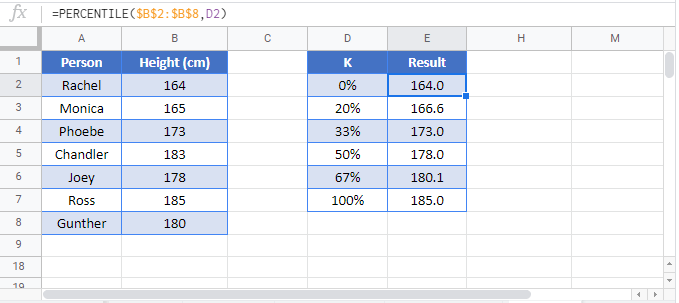
PERCENTILE Examples in VBA
You can also use the PERCENTILE function in VBA. Type:
application.worksheetfunction.percentile(array,k)
For the function arguments (array, etc.), you can either enter them directly into the function, or define variables to use instead.