How to Create an Outline in Excel & Google Sheets
In this tutorial, you will learn how to create an outline in Excel and Google Sheets.
Create an Outline
An outline in Excel allows you to group or ungroup rows. You can also use an outline to display subtotals. This can help to group rows in order to outline data in complex data sets. Say you have the following range of values.
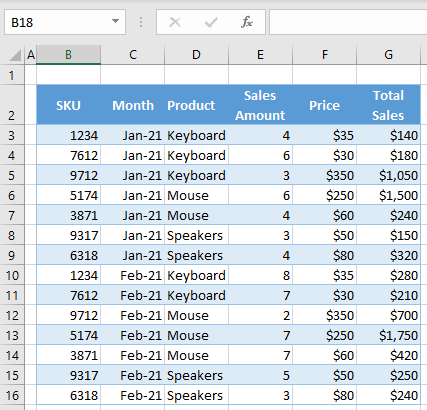
To create an outline, one option is to add subtotals to the data range. For example, let’s add subtotals for Total Sales (Column G), by Product (D).
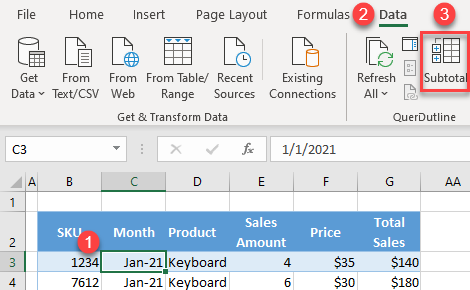
1. Select any cell in the range (for this example, B3:G16).
2. In the Ribbon, go to Data > Subtotal.
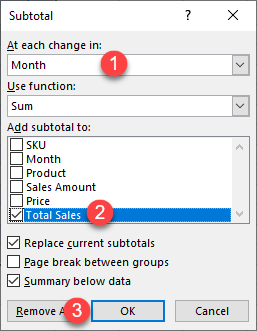
3. In the Subtotal window, (1) choose Month in the first drop-down list, and (2) check Total Sales, for adding subtotal to, and (3) click OK.
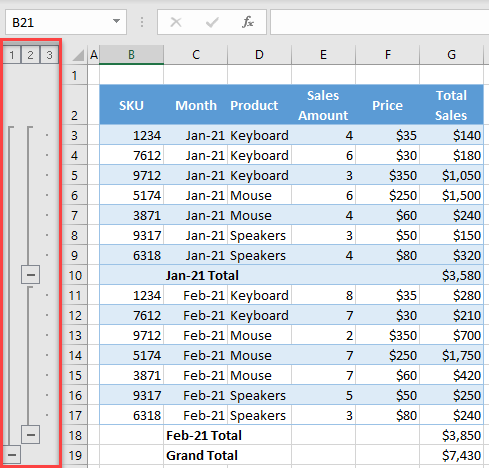
As a result, the outline is created on the left side of the data, and subtotals are added.
In the outline bar, you can expand or collapse rows using the plus/minus sign next to total rows. Also, you can expand/collapse all categories at once by clicking on a number at the top of the outline bar. Number 1 represents Grand Total, while numbers from 2 stand for subtotal categories.
Create an Outline in Google Sheets
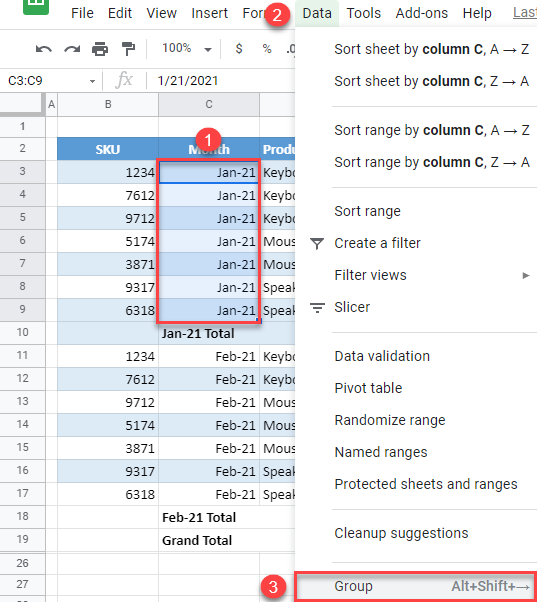
To create an outline in Google Sheets, you have to group some rows. For example, let’s group data by month (Column C).
1. Select the data range for grouping (e.g., Jan-21, C3:C9).
2. In the Menu, go to Data > Group (or use the keyboard shortcut ALT + SHIFT + RIGHT ARROW).
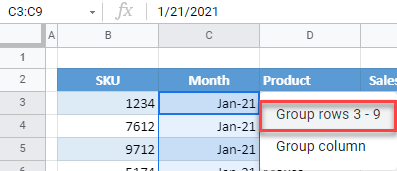
3. In the pop-up menu, click Group rows 3 – 9.
As a result, an outline is created on the left side of the sheet.
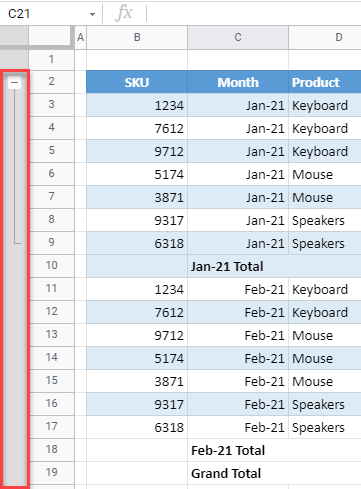
Using the outline, you can expand or collapse groups one by one by clicking on plus/minus sign.