Insert Line / Column Sparklines in Excel & Google Sheets
This tutorial demonstrates how to insert sparklines in Excel and Google Sheets.
What Are Sparklines?
Sparklines are small graphs that are contained within one cell. They are often placed near relevant data to optimize the amount of space taken up. Data that a sparkline uses is organized in the same way as data would be organized in a regular chart. You can have Line, Column, or Win/Loss Sparklines.
Line Sparkline
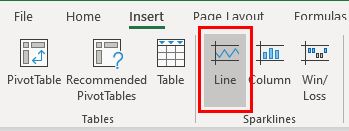
- In the Ribbon, select Insert > Sparklines > Line.
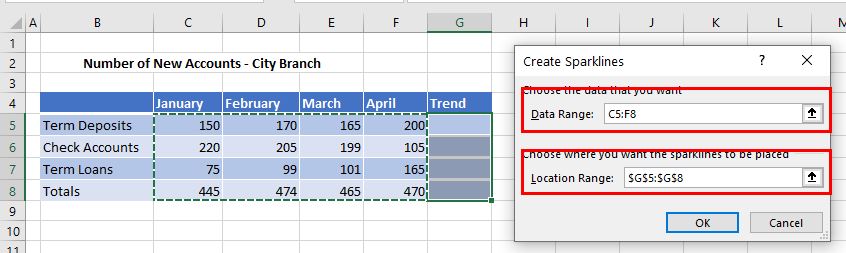
- Select the data range to create the sparkline for, and then select the location range for the sparkline.
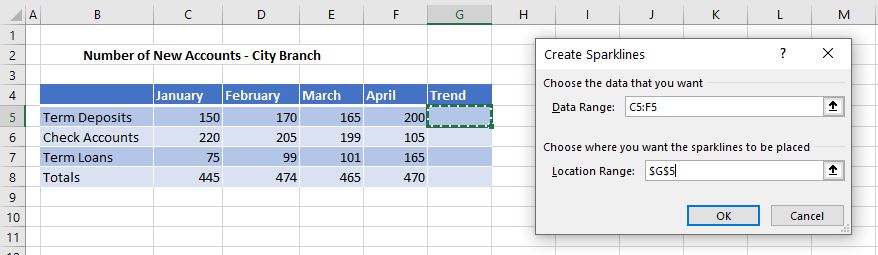
- Click OK.
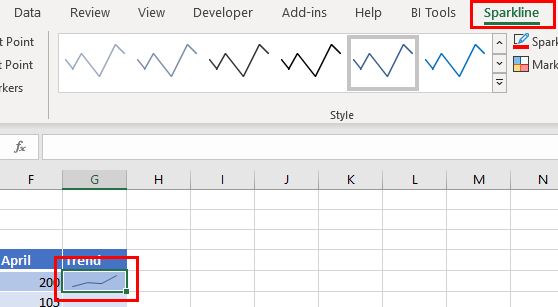
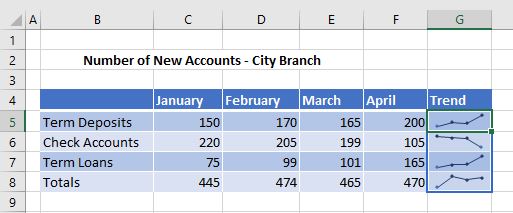
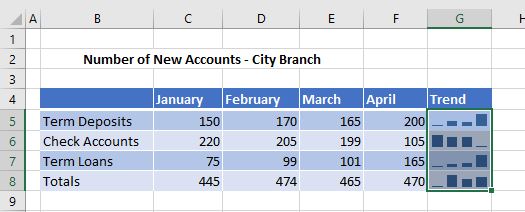
A sparkline is added to the selected range (in this case, a single cell, G5) and a new tab called Sparkline appears on the Ribbon.
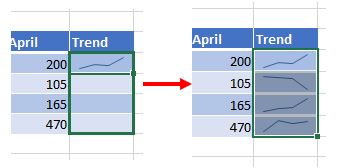
- Select the range of cells for the Data Range as well as for the Location Range when creating the sparkline.
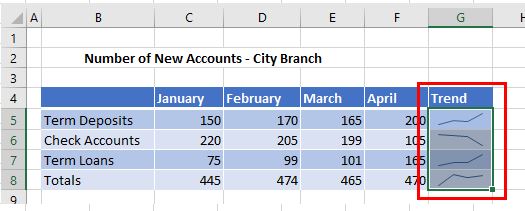
- Click OK to insert multiple sparklines into the worksheet.
Clear Sparklines
Select the sparklines you wish to clear and then in the Ribbon, select Sparklines > Clear > Clear Selected Sparklines.
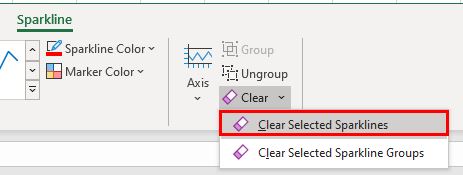
The Sparklines tab on the Ribbon then disappears.
Column Sparkline
- In the Ribbon, select Insert > Sparklines > Column.
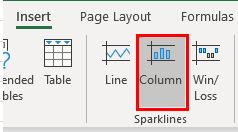
- Select the Data Range and Location Range as you did when inserting a Line Sparkline above, and then click OK.
Alternatively, if you already have line sparklines in the location range, you can change the type of sparkline to Column by selecting Sparkline > Type > Column in the Ribbon.
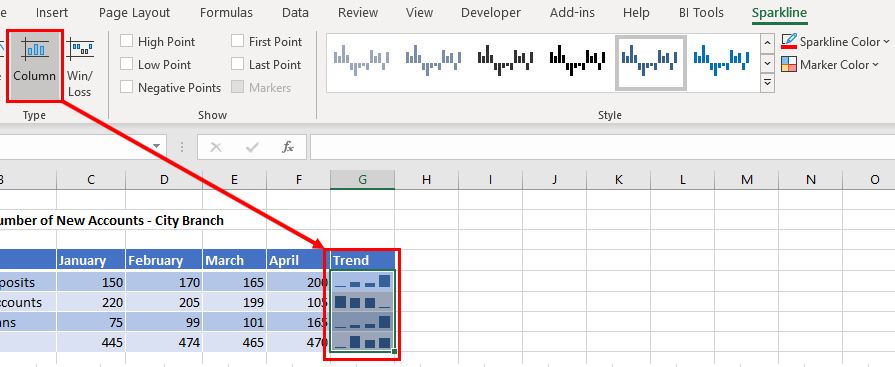
You can also use the Sparkline tab on the Ribbon to amend the Style and Color of the sparkline, or to show points on the sparkline.
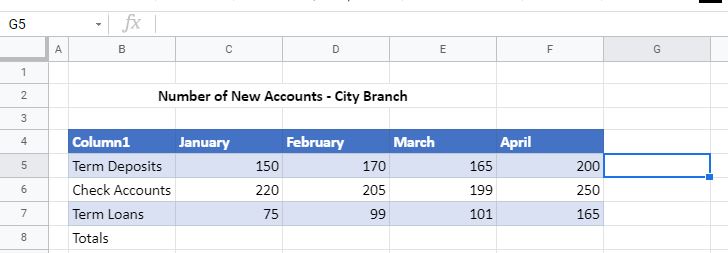
Insert Sparklines in Google Sheets
Inserting sparklines in Google Sheets is completely different. In Google Sheets, you have to use a formula to insert sparklines.
- First select the cell where you want the sparkline to be shown.
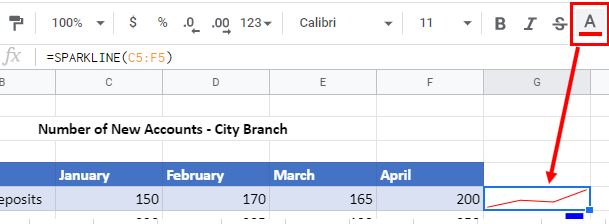
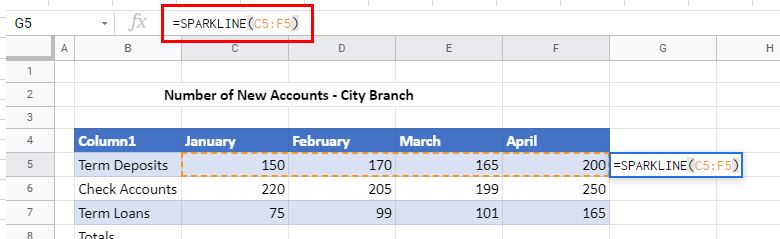
- Then type the SPARKLINE Function formula and highlight or type the data range.
=SPARKLINES(C5:F5)
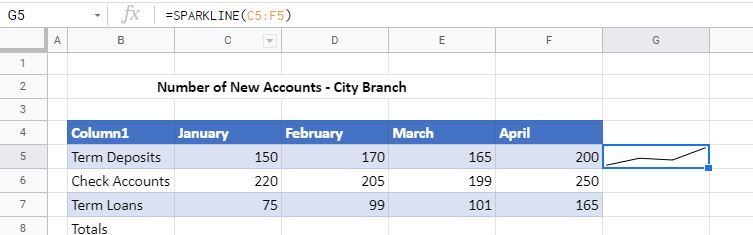
- Press ENTER to insert the sparkline into the spreadsheet.
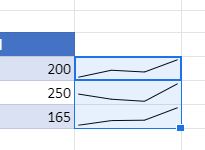
- Then use the handle at the bottom of the selected cell to copy the sparkline down to the cells below.
Google Sheets Sparkline Options
There is no Sparkline tab in Google Sheets. Instead, the properties of sparklines are defined within the formula.
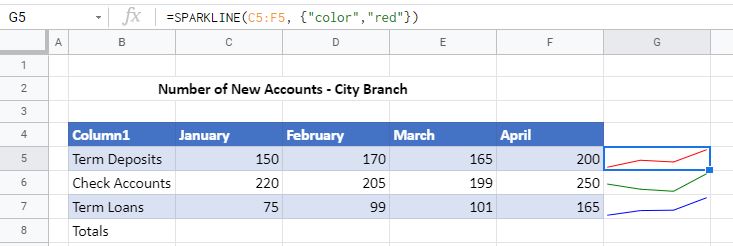
- To change the color of the sparkline, amend the formula.
=SPARKLINE(C5:F5, {"color","red"})
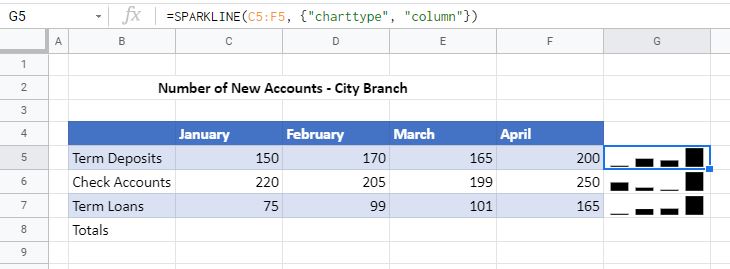
- To change the sparkline type to Column, you also need to amend the formula.
=SPARKLINE(C5:F5, {"charttype", "column"})
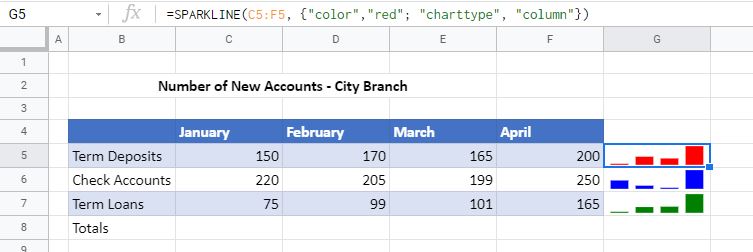
- To change the color and the type, you can combine the two options in one formula, separating them by means of a semicolon.
=SPARKLINE(C6:F6, {"color","blue"; "charttype", "column"})
- You can also change the color of the sparkline by changing the color of the text in the cell selected. In the Menu, select Text Color, and select a color.