Do a Sensitivity / What-If Analysis in Excel
This tutorial will demonstrate how to do a sensitivity analysis in Excel.
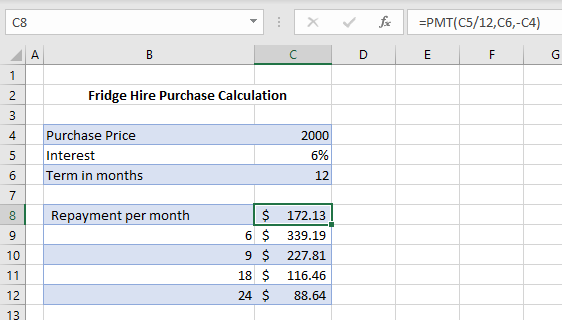
Single-Input Data Tables
A single input data table enables us to change one variable in a table in order to see various results known as a What-If Analysis. In the graphic above, the repayment period in months has been expanded to show what the repayment would be if the term were 6, 9, 18, or 24 months, as well as the original 12 months that the formula in C8 is using.
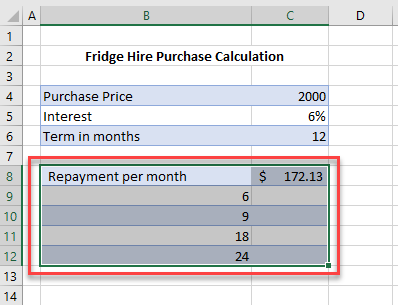
1. Highlight the data table area in your worksheet.
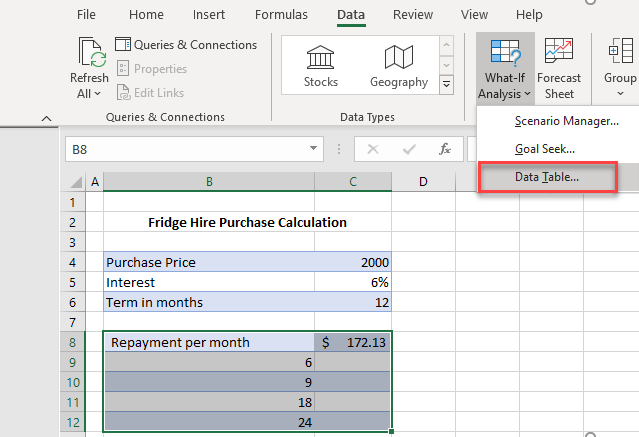
2. In the Ribbon, select Data > What-If Analysis > Data Table.
3. As we are doing a single-input data table, and the terms we are changing are going down a column, we populate the column input cell with the cell address C6.
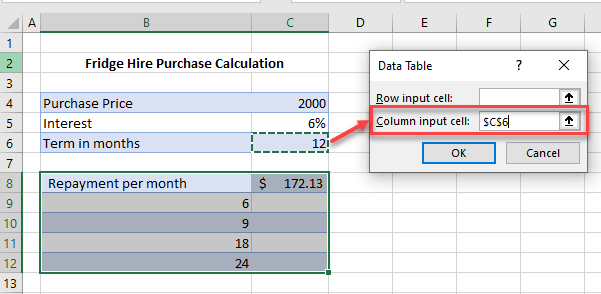
4. This will amend the formula in cell c8 for each row in the data table, picking up the values in Column B (i.e., 6, 9, 18, and 24) in place of the value 12 in C6. Click OK.
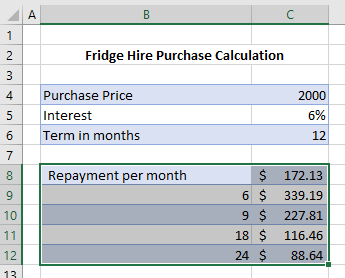
5. The table will be filled in with the new scenarios.
Double Input Data tables
A double input data table enables us to change two variables at the same time: both the row and the column.
Consider the following worksheet.
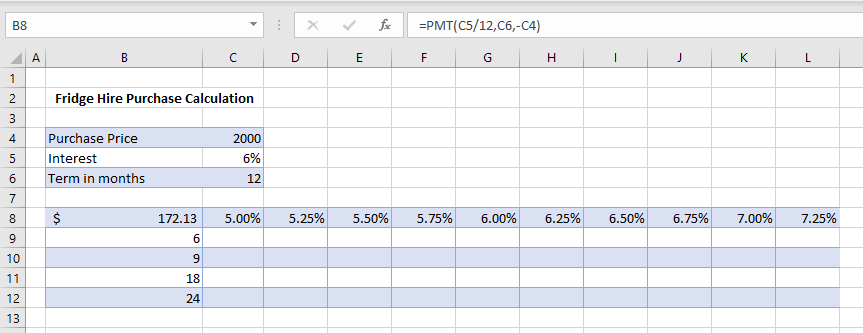
In this scenario, we wish to see what our repayments would be if both the term, and the interest rate were to change.
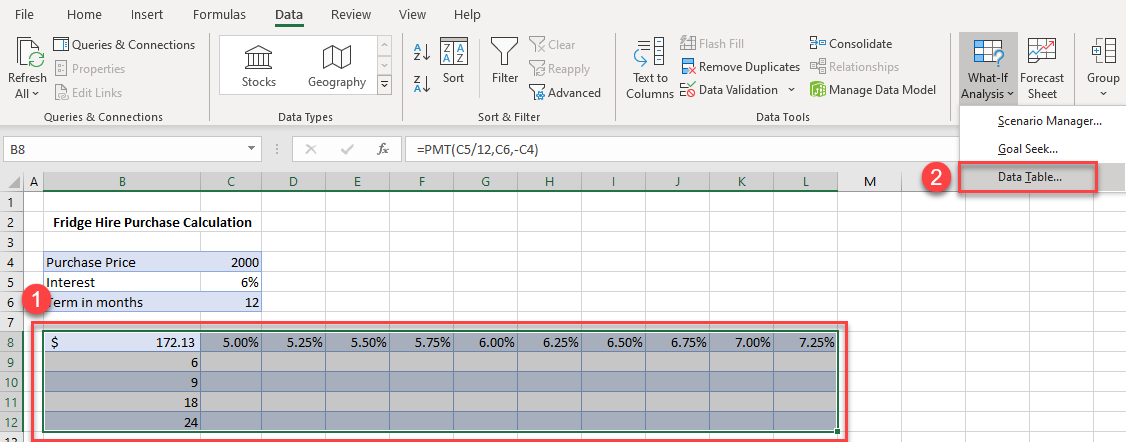
1. First, (1) highlight the data table, and then, (2) in the Ribbon, select Data > What-If Analysis > Data Table.
2. In the row input box, select C5 (the interest rate), and in the column input cell, select C6 (the term).
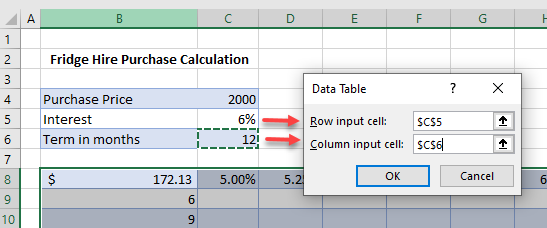
3. Click OK.
