Percentage Breakdown in Range Excel and Google Sheets
Download the example workbook
This tutorial demonstrates how to use the COUNTIF and COUNTA functions to calculate percentage breakdown for a range.

Percentage Breakdown of Values in a Range
To create a summary breakdown containing the percentage of times values appear in a range, use this formula:
=COUNTIF(Range, Criteria) / COUNTA(Range)Let’s look at an example, in this data set, we have a list of job applications for the role of a Financial Analyst. In this case, we want to count the percentage of applications for each study background.
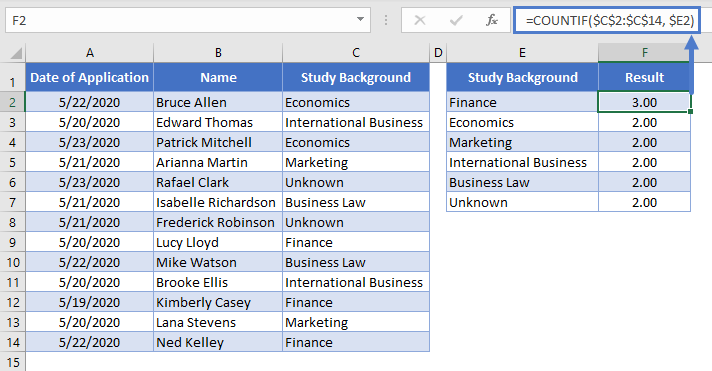
The COUNTIF function counts the number of times each item appears in the list
=COUNTIF($C$2:$C$14, $E2)
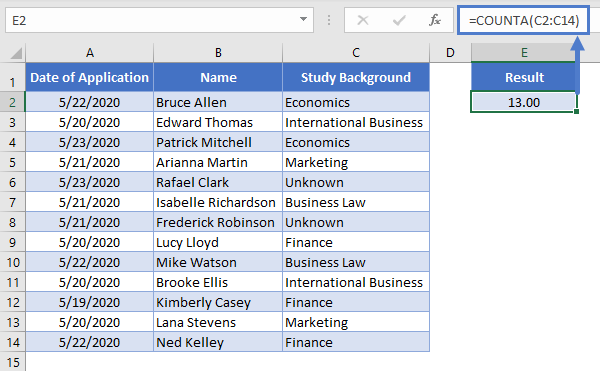
While the COUNTA function will count all the cells in that range (skipping blank cells).
=COUNTA(C2:C14)
By dividing the COUNTIF function by the COUNTA function, you calculate a percentage representing how often a certain item appears in the list.

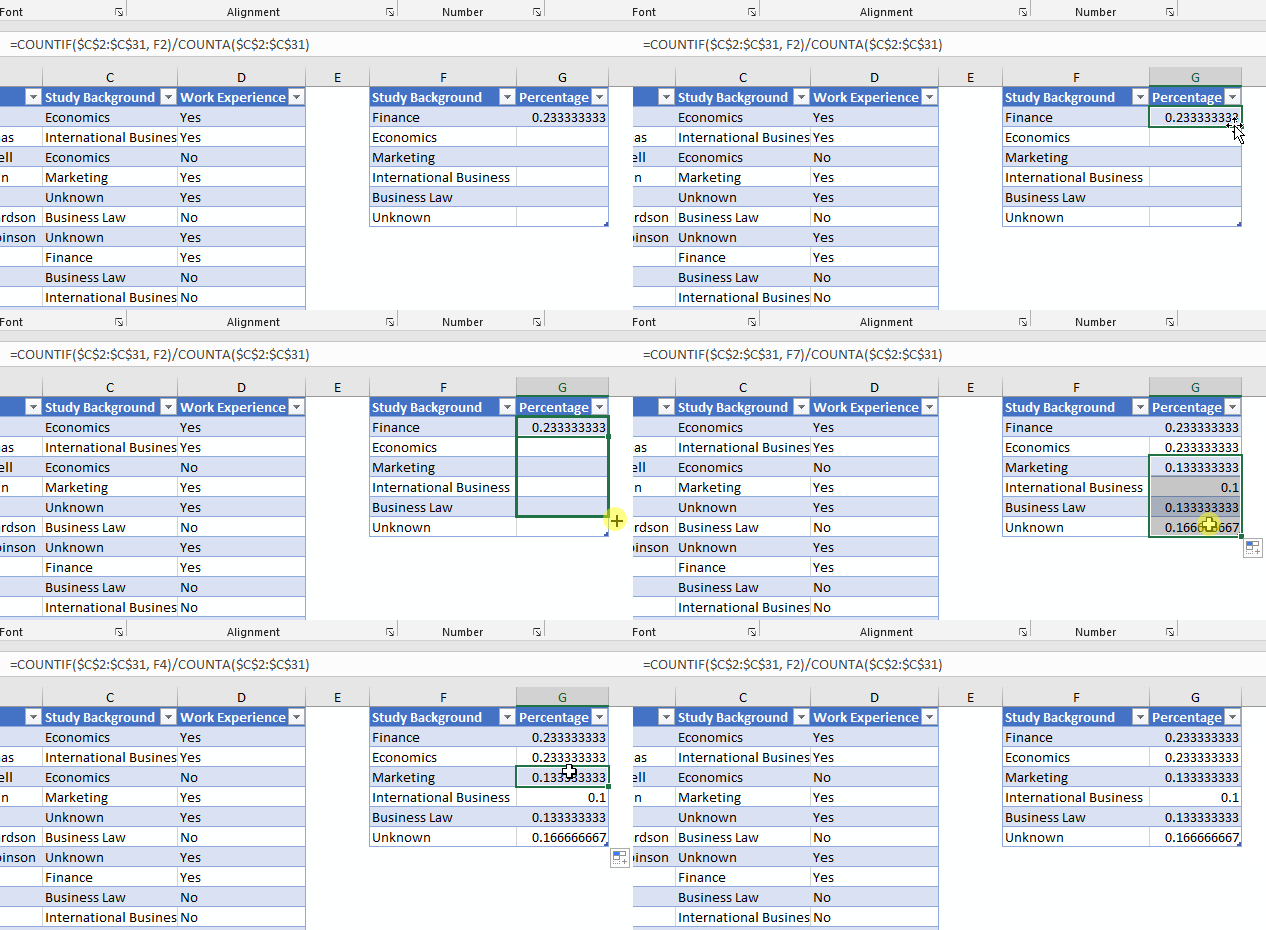
=COUNTIF($C$2:$C$31, Study Background) / COUNTA($C$2:$C$31)By organizing the study backgrounds in a list, we can use a relative reference to drag the formula down to build a summary table.

After doing that, change the format of the values to a percentage value.

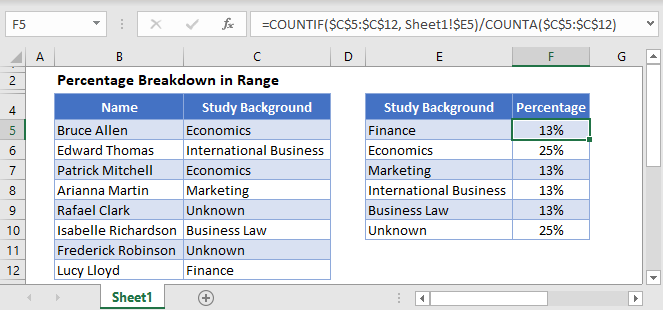
We now have a summary count with a percentage breakdown for each study background in the job applications.

Percentage Breakdown in Range in Google Sheets

We use the same formula structure for Google Sheets to get the same result.
=COUNTIF(Range, Criteria) / COUNTA(Range)