How to Group Cells (Rows / Columns) in Excel & Google Sheets
This tutorial will demonstrate how to Group Cells (Rows / Columns) in Excel & Google Sheets.
Grouping or outlining data in Excel allows us to hide or show rows or columns depending on how much detail we wish to see on the screen. Different levels can be displayed according to your needs. Excel allows up to 8 levels of grouping. To use the group function in Excel, the data really needs to be organized in your worksheet in a specific way that works with the grouping functionality.
Manually Grouping or Ungrouping Rows
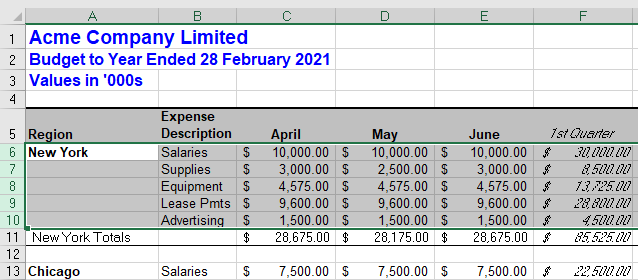
1. To group a number of rows together, first, highlight the rows you wish to group.
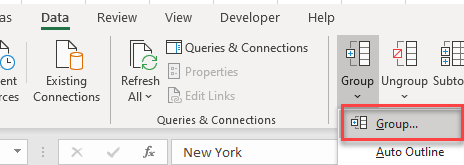
2. In the Ribbon, select Data > Outline > Group >Group.
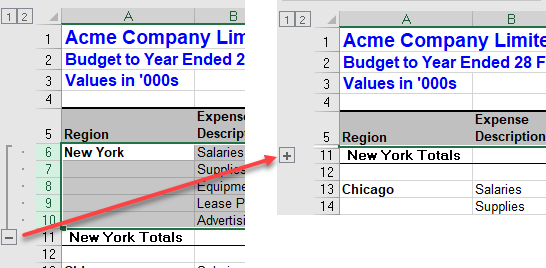
3. A small minus sign will be added into the outline bar on the left of the screen. Clicking on the minus sign allows us to collapse the group and the minus sign will then change to a plus sign indicating that there is hidden data within the outline.
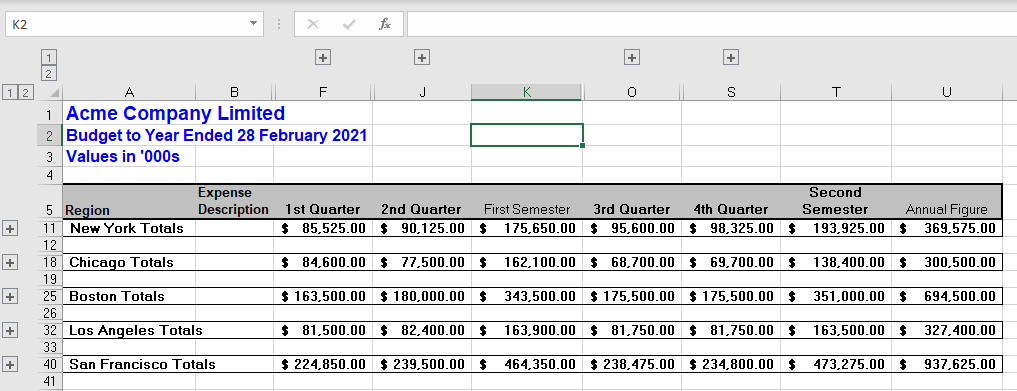
4. We can repeat manual grouping to add more groups to the worksheet as required.
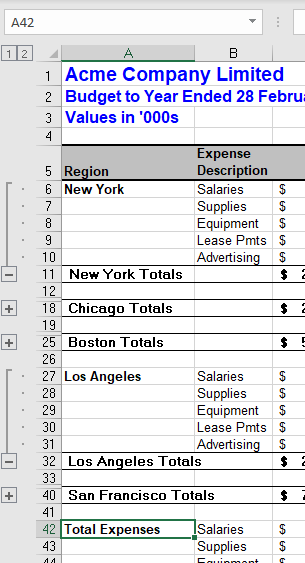
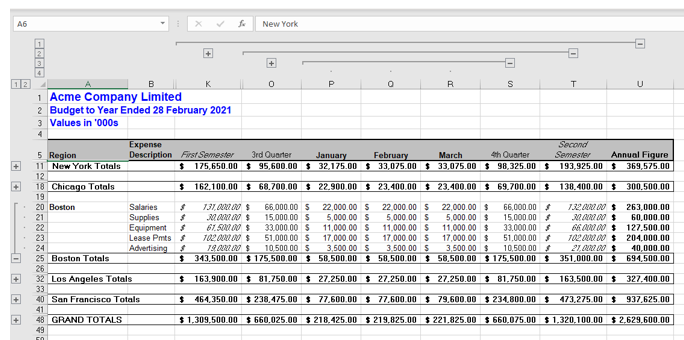
5. As well as using the plus and minus outline symbols, we can also use the 1 or 2 in the top left hand corner of the screen to expand or collapse all the groups.
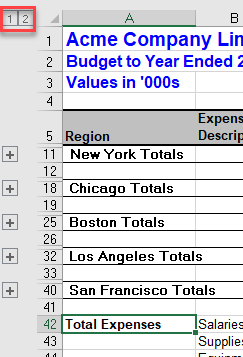
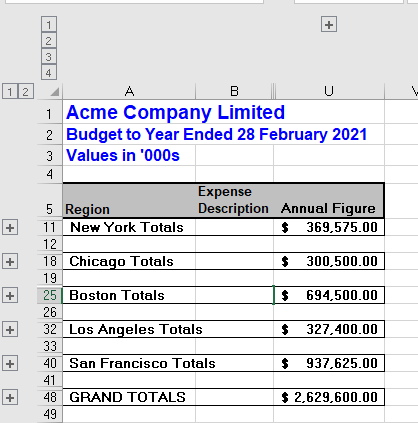
6. Clicking on the 1 will collapse all the groups while clicking on 2 will expand all the groups.
Manually Grouping or Ungrouping Columns
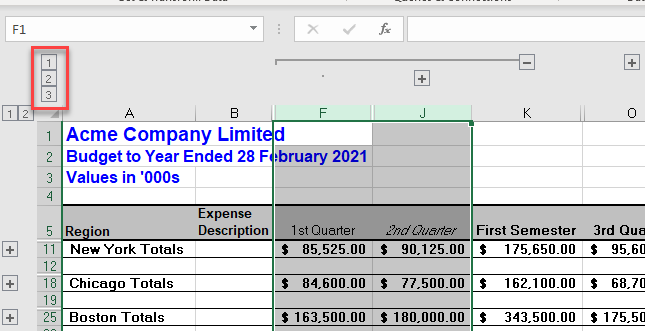
1. To group a number of columns together, first, highlight the columns you wish to group. This can be done if you have rows already grouped or not.
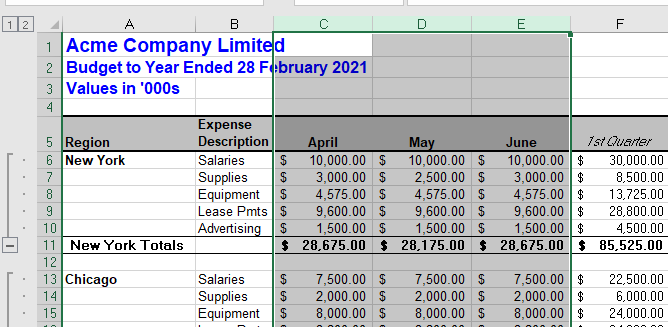
2. In the Ribbon, select Data > Outline > Group >Group to group the columns together. Repeat this until you have created all the groups that you require.
3. Once we have grouped our rows and / or columns, we can add a new level but grouping once again. This will add a third level of grouping to the outline symbols in the top left hand corner of the screen.
4. Once again, we can repeat this across our worksheet, and add up to 8 levels of grouping.
Ungrouping Rows or Columns
1. Highlight the group you wish to ungroup and then, in the Ribbon, select Data > Outline > Ungroup > Ungroup.
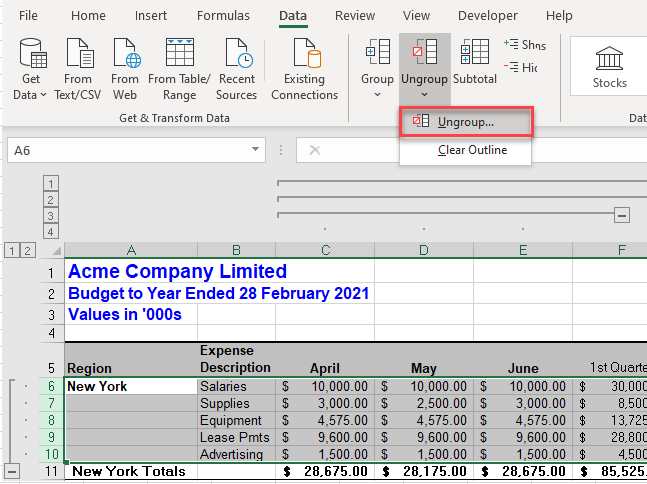
This will only remove the one group.
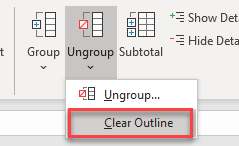
2. To remove all the grouping in the worksheet, click anywhere in the data and then, in the Ribbon, select Data > Outline > Ungroup > Clear Outline.
Auto-Outline
We can use the Auto Outline function of Excel as long as our data is logically organized so that Excel recognizes the groups within the rows and columns. There must not be any blank rows in the data and the data must be summed or subtotaled at each level.
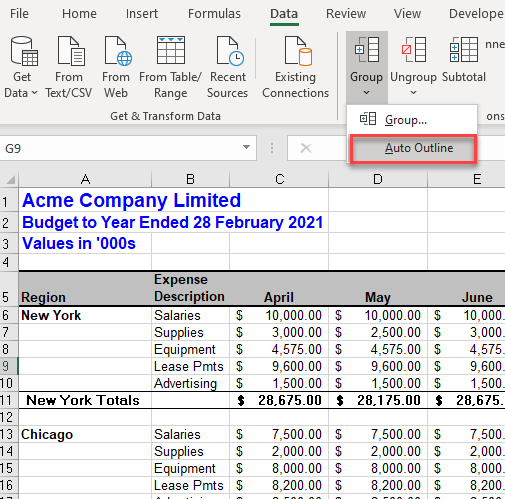
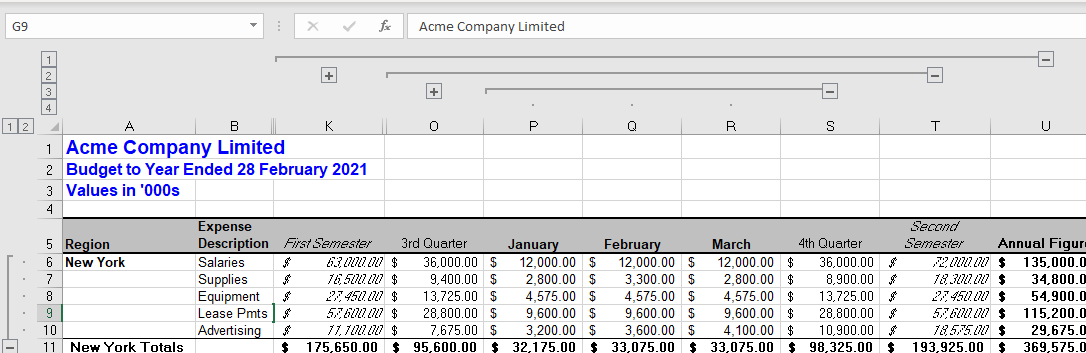
1. Click anywhere in the data where you wish the outline to be created and then, in the Ribbon, select Data > Outline > Group > Auto Outline.
2. Excel will create as many grouping levels as the logical layout of the data allows.
How to Group Cells in Google Sheets
Google Sheets only allows us to manually group or ungroups rows and columns of data.
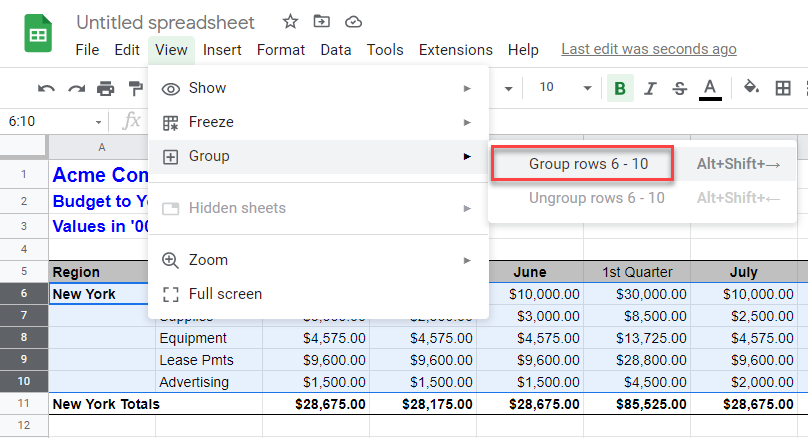
1. Select the rows you wish to group and then, in the Menu, select View > Group > Group rows (the number of rows selected will be shown).
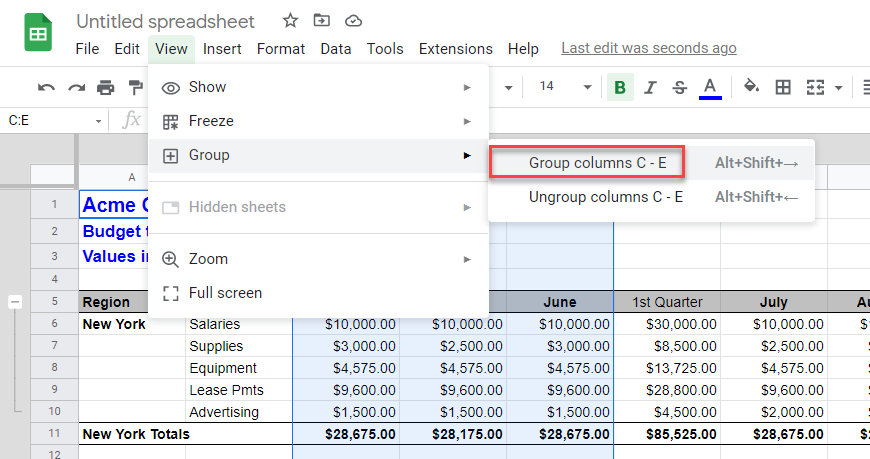
2. Similarly, select the columns you wish to group and then in the Menu, select View > Group > Group columns (the number of columns selected will be shown).
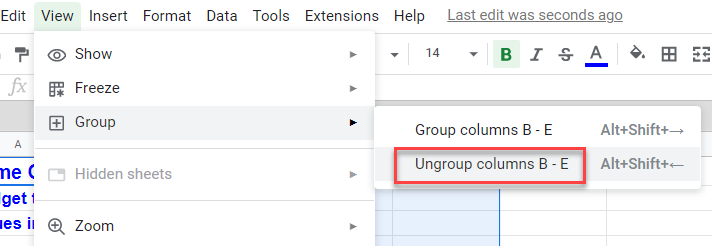
3. To ungroup rows or columns, click in the group you wish to ungroup and then in the Menu, select View > Group > Ungroup (rows or columns).